Analytics overview
Every metric on the analytics dashboard in plain language — deflection, resolution, CSAT, conversion, and why the two credit numbers differ.
Analytics answers one question: is the agent doing useful work? Pick a range — Today, Last 7 Days, Last 30 Days, This Month, Last Month, Last 90 Days, or Last Year — and every figure on the page moves with it.
Watch which one you are on before reading a number: early in a calendar month, This Month is a handful of conversations and a resolution rate computed over them, which is a true reading of an unrepresentative window. Last 30 Days is usually what you want.
Test chats from the playground are excluded from the outcome metrics, so your own experiments do not flatter the numbers.
Outcome metrics
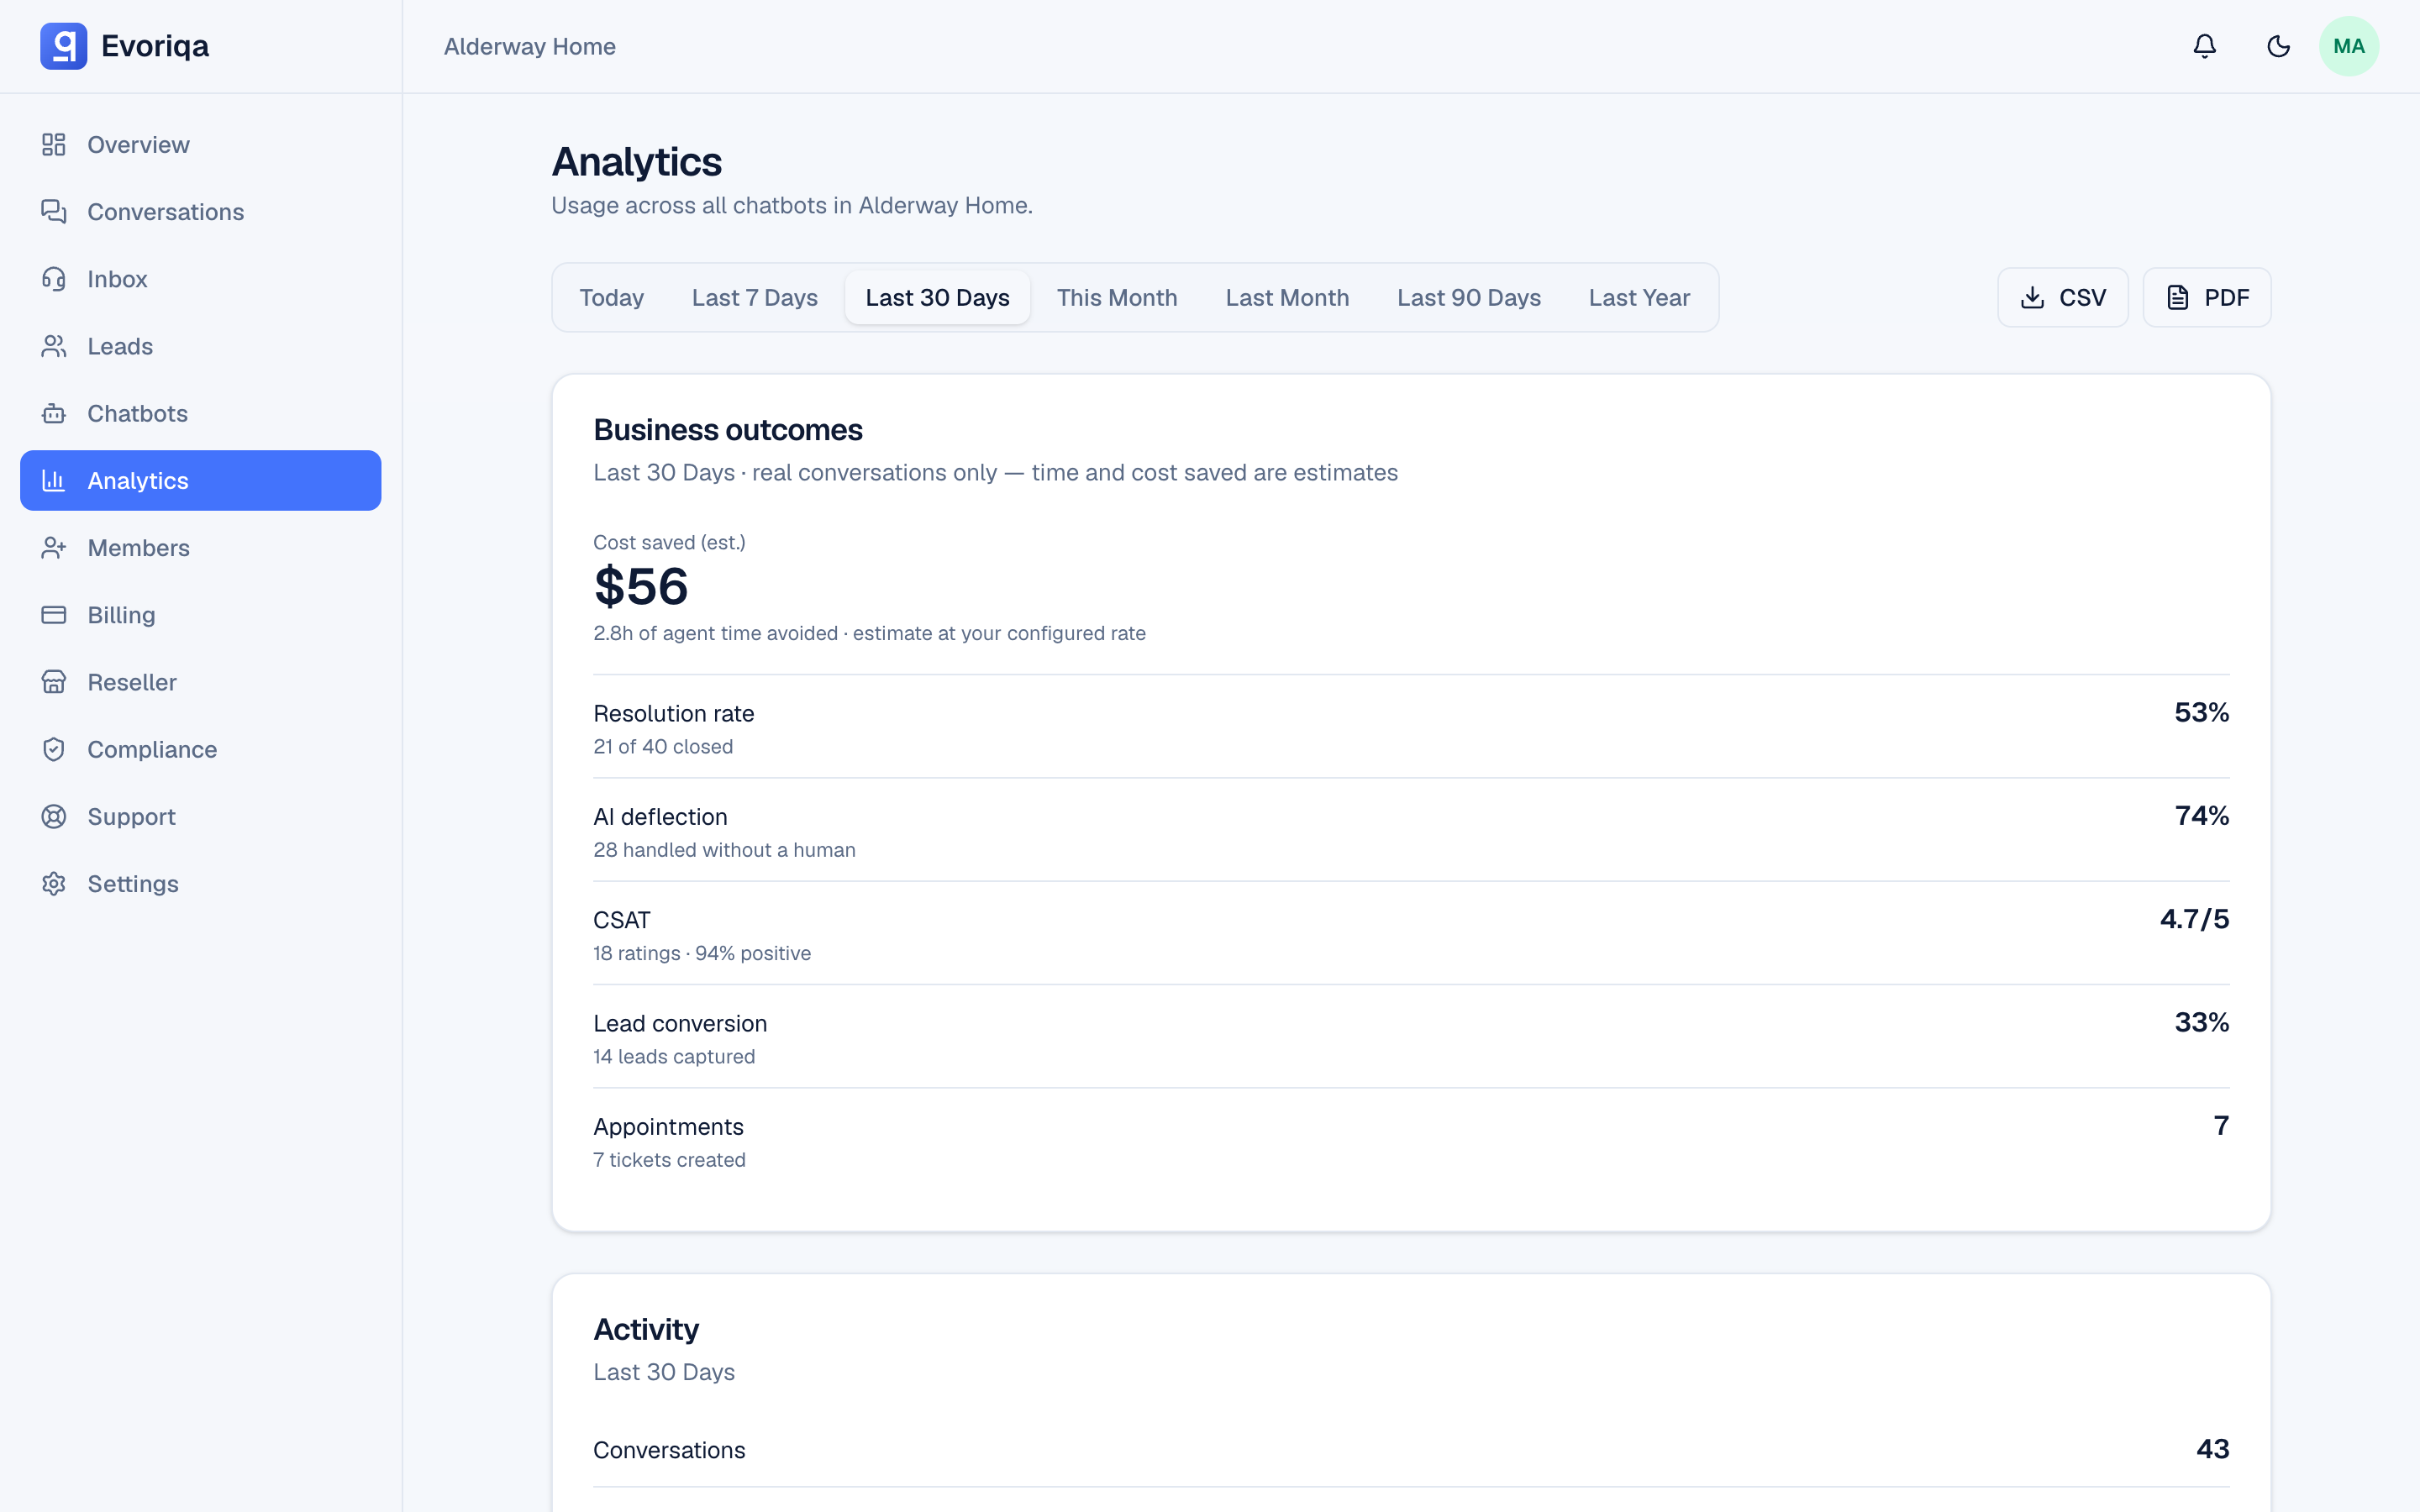
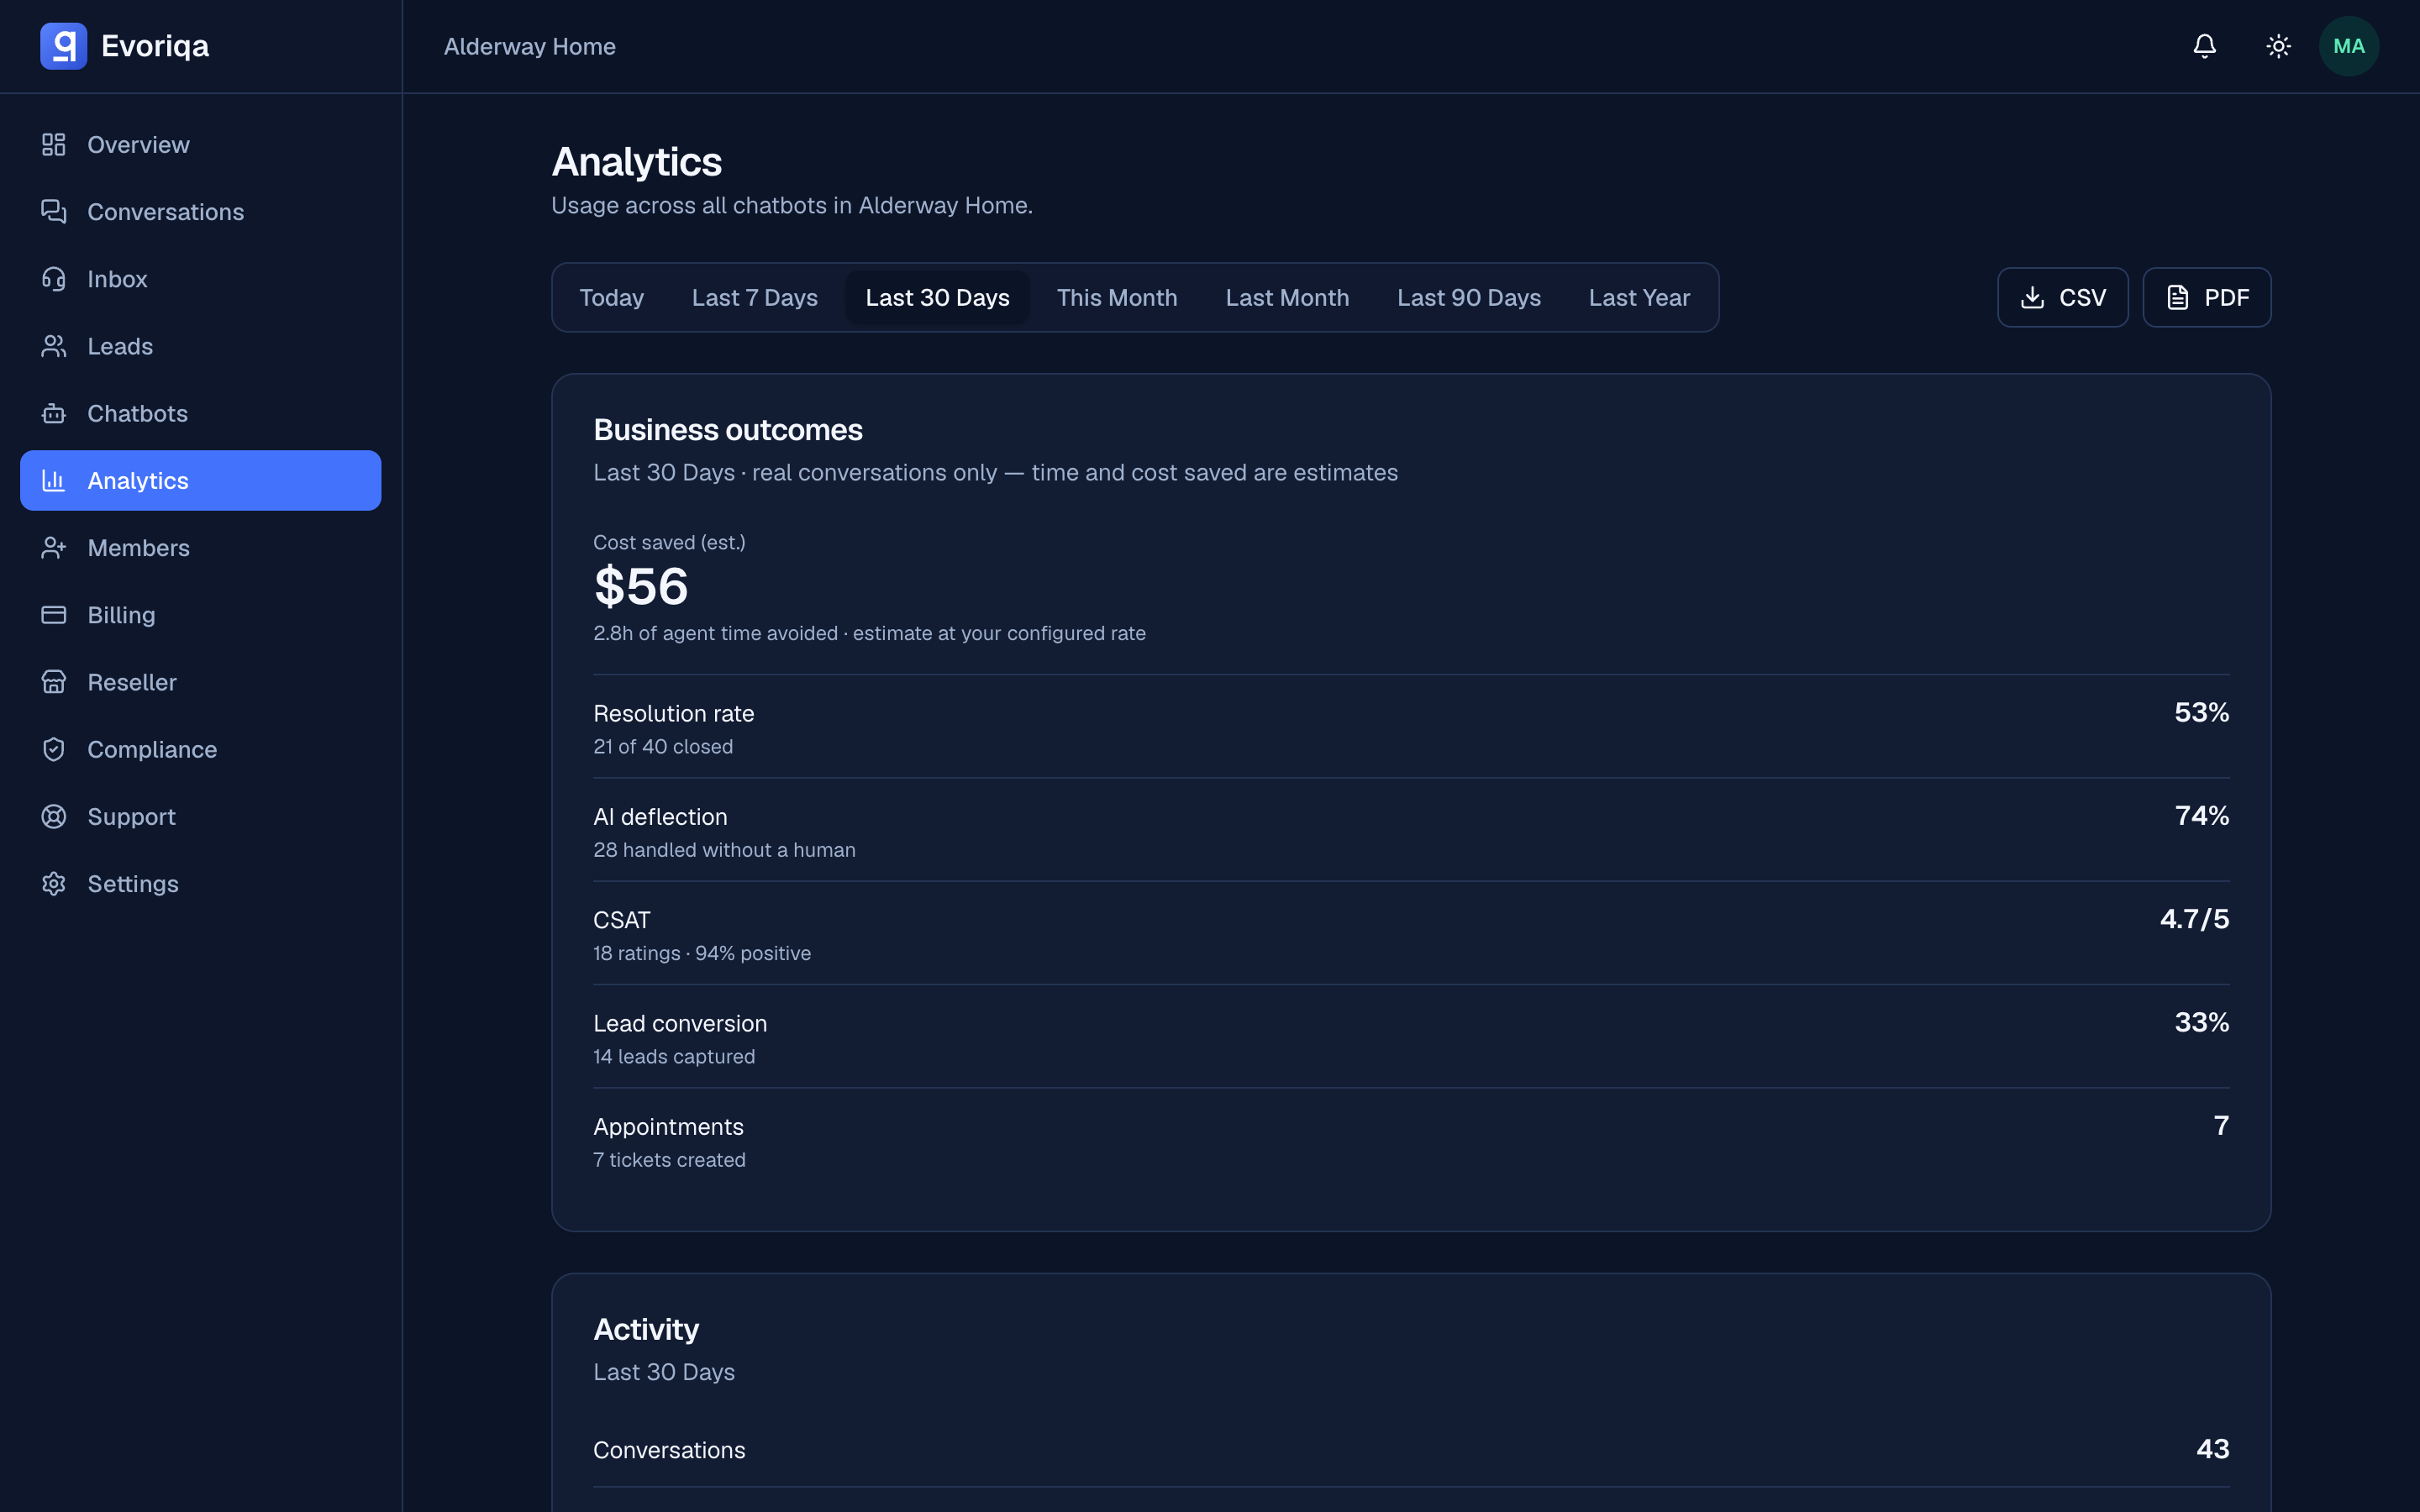
The card is headed Business outcomes, and carries the window plus a standing caveat: real conversations only — time and cost saved are estimates.
| Metric on screen | Plain meaning |
|---|---|
| Resolution rate | Share of conversations that ended closed, with the count beneath it (21 of 40 closed). |
| AI deflection | Share the AI handled with no human handoff (28 handled without a human). The headline number. |
| CSAT | Average 1–5 rating from the end-of-chat card, with the number of ratings and the share that were positive. |
| Lead conversion | Share of conversations that captured at least one lead, with the lead count. |
| Appointments | Successful booking runs, with tickets created shown alongside. |
| Hours saved | Estimated human time avoided, with the money figure beneath it (≈ $56 agent cost avoided). See Agent cost. |
Handoff rate is simply the mirror of AI deflection: 74% deflected means 26% reached a person.
Hours and cost saved are estimates built from your own agent-cost setting. They are useful for a trend and for a board slide; they are not an accounting figure.
Viewers see the outcomes, not the money. A viewer keeps resolution, deflection, CSAT, conversion, and appointments, but their Analytics drops the cost-saved estimate (and the hours-saved figure shown with it) and the credit-spend tiles. Those money numbers are for owners, admins, and members.
Volume and quality
- Conversations — total, split into public and test.
- Messages and AI replies.
- Unanswered — replies with no sources attached. The same signal that drives knowledge gaps.
- Average latency — how long answers take.
- Average QA score — the Live AI QA judge's average over scored replies in the range, with the below-passing count alongside. Only appears once something has been scored.
- Messages over time — the volume series for the selected range.
- Top questions — the most frequent real questions, which is where topics starts.
- Recent feedback — verbatim CSAT comments, lowest ratings first.
Credits used: why two numbers differ
The Credits used tile on Analytics and Credits used this month on Billing count different things, deliberately:
| Figure | Counts |
|---|---|
| Analytics — Credits used | Every usage event in the range, including record-only overhead and usage that never drew down a balance |
| Billing — Credits used this month | Only the ledger debits for the current UTC calendar month |
So Analytics ≥ Billing is expected, not a bug. Analytics tells you what the AI did; Billing tells you what you were charged for. See Credits and top-ups.
Where to go next
Last updated